FlowState — CYVL Hackathon
Turning raw mobile-LiDAR street scans into a browser-viewable 3D model and a flood-simulation input, end to end.
🏆 Finalist | Invited to interview with the CYVL team
Overview
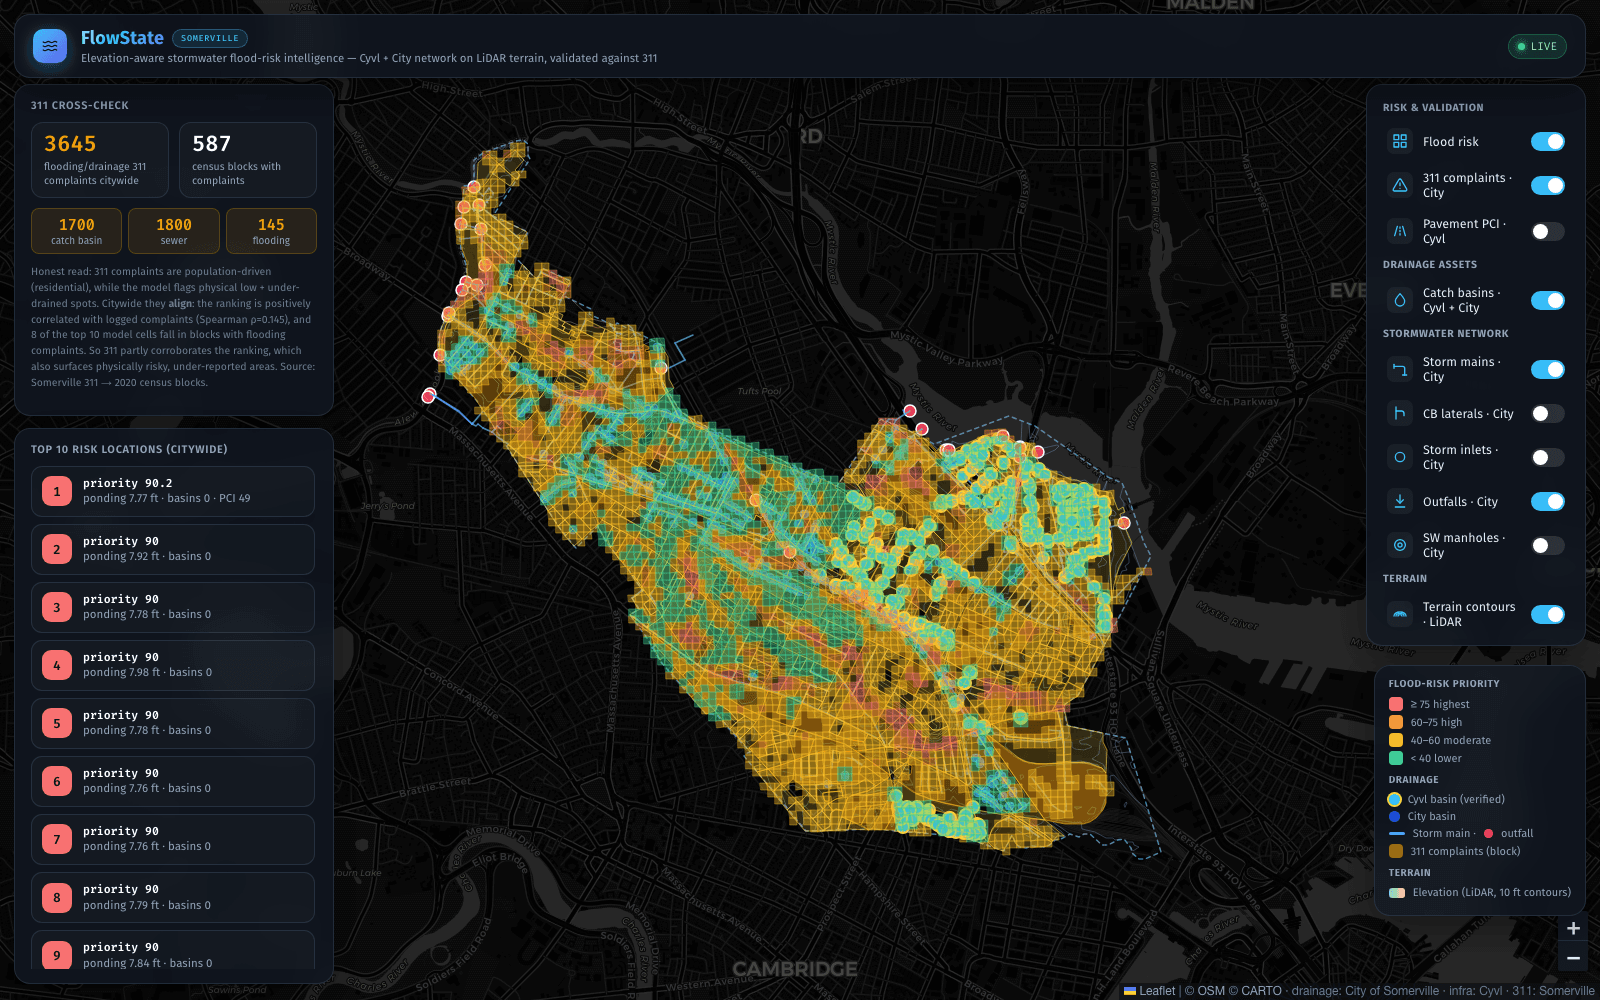
CYVL's constraint: build something useful with their mobile-LiDAR scans of city streets. FlowState is the flood-risk map that resulted, showing the public where water will go during a storm. I built the pipeline in between, turning CYVL's raw 354 MB street scan (hundreds of millions of points) into both a 3D model you can view in a browser and the terrain data the flood simulation needs. That included writing a ground-classification step from scratch after the standard tool wouldn't install mid-hackathon.
The Pipeline
One input, two outputs:
- Raw mobile-LiDAR
.lazscan of city streets: 354 MB, hundreds of millions of points. - SMRF ground classification separates ground returns (road, sidewalk, terrain) from everything above it (cars, poles, canopy).
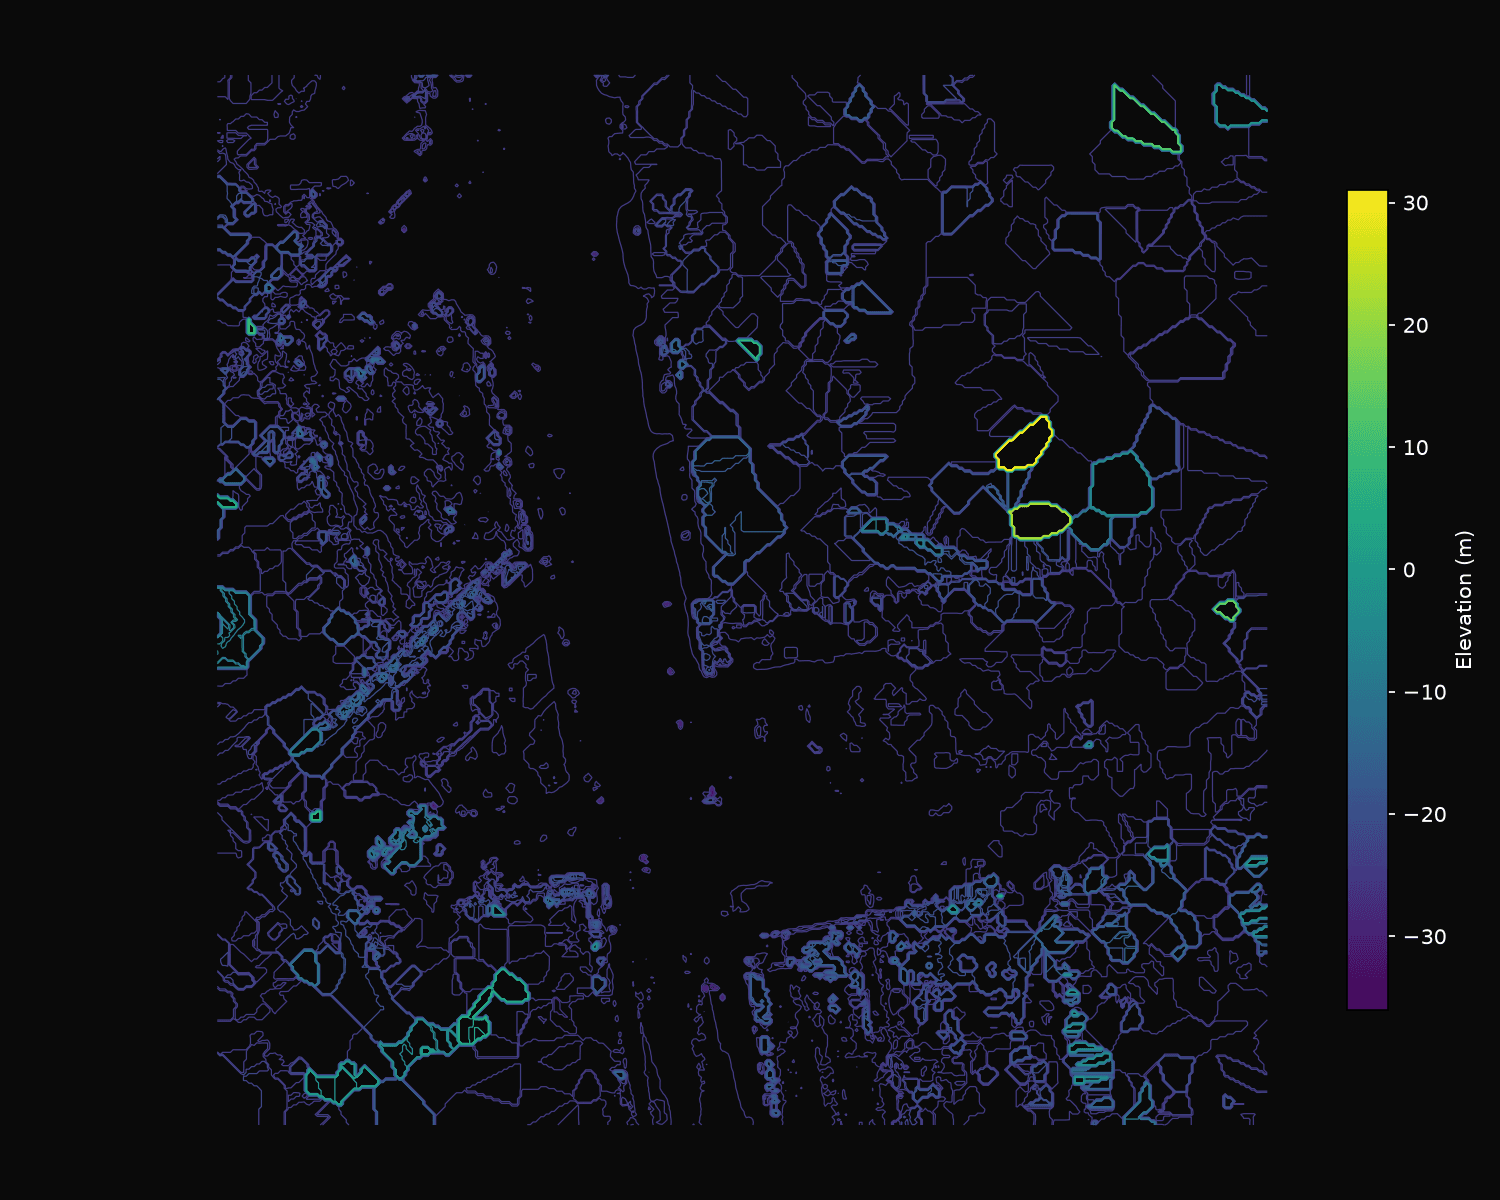
- Fork one: ground points become contour lines, exported to DXF for AutoCAD / Civil 3D, the format engineers actually work in.
- Fork two: ground points become a heightfield mesh, exported to OBJ/MTL, uploaded to Autodesk Platform Services (signed S3 upload → SVF2 cloud translation), and rendered in a browser-based Viewer.
- That same classified geometry is the input to the flow simulation whose output FlowState displays.
Tech Stack
- Point cloud processing: PDAL (SMRF ground classification), with a hand-written NumPy fallback
- Geometry export: contour lines → DXF, ground mesh → OBJ/MTL
- 3D viewing: Autodesk Platform Services: signed S3 upload, SVF2 translation, browser Viewer SDK
- Frontend: Next.js map UI (FlowState) consuming the simulation output
My Contributions
Solo repo: every commit in the pipeline is mine, built in one ~8-hour day.
- Wrote the full point-cloud pipeline: header-only extent reads, PDAL-side cropping, 0.10 m voxel downsampling, and vectorized NumPy scatter-adds (
np.add.at) in place of Python loops to keep hundreds of millions of points tractable on a laptop - Built the contour → DXF export path for AutoCAD / Civil 3D
- Built the ground mesh → OBJ/MTL → Autodesk Platform Services pipeline: signed S3 upload, SVF2 translation, and the browser Viewer integration
- Fixed a WebGL precision bug: raw UTM 19N coordinates (~328000, ~4692000 m) break float precision on the GPU, so geometry is origin-shifted to the region-of-interest centre before export
Challenges
PDAL is conda-only and refused to install on an M3 Mac mid-hackathon. Rather than lose the classification step, I wrote a from-scratch NumPy replacement for SMRF ground classification: sort every point by (elevation, grid-cell key) with np.lexsort, find each cell's first occurrence with np.unique(return_index=True), then pull a per-cell 10th-percentile elevation with pure offset arithmetic. No Python-level loop runs over hundreds of millions of points.
What Didn't Ship
Road / sidewalk / grass material classification is fully built: a 14-material MTL, per-cell argmax voting, and primitives for cars, poles, hydrants, and canopies. But the classifier never got wired into the final run: run.py hardcodes every ground cell to "grass". The Somerville ArcGIS fetcher that would have supplied real road and sidewalk polygons was written and never called. Both are scaffolding for a v2 the clock didn't allow.
Project Media
Links
Tools & Methods
Built at the CYVL Hackathon.